Shin Huoy's GIS Portfolio
Analysis of urbanization trends in Chengdu, China, between 1990 and 2014 through remote sensing
By Terh Shin Huoy, Teoh Shi Hao Sean & Song Shuang
This project demonstrates the application of remote sensing in land cover change analysis. I learnt how to obtain satellite images, interpret the different layers and process the images. The decision-tree method for land cover classification was adopted.
Introduction
The specific study area of interest is the city of Chengdu, the administrative and cultural centre of Sichuan province in China. Many heavy and military industries were located there in the 1970s but diminishing threats have resulted in the transformation of these industries to provide for civilians rather than the military, providing the infrastructural base for the local economy to grow quickly (Webster et al., 2003). This project seeks to trace the urbanization of Chengdu between 1990 and 2014 using remote sensing techniques and explain the implications on societies and the environment.
Methodology
1. Data collection
Pre-processed Landsat 5 and 8 images with the following characteristics were downloaded from the Landsat Archive, EarthExplorer website (USGS, 2016) for analysis:
-
Path/Row: 129/039.
-
Cloud cover: Less than 10%.
-
Months: June, July, August, September.
-
Years (Landsat 5): 1990, 1991, 1992, 2002, and 2009.
-
Years (Landsat 8): 2014.
2. Land use classification
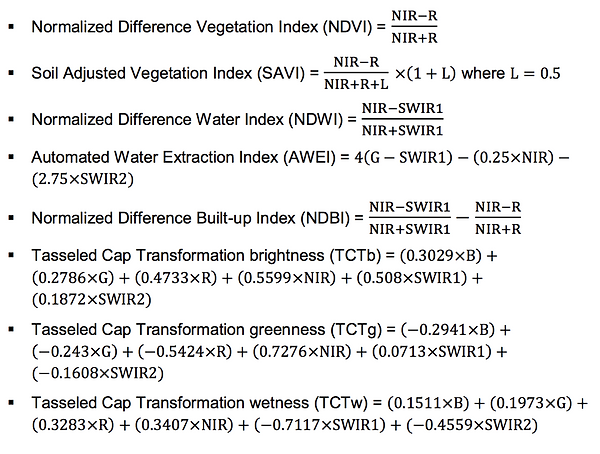
The following land use indices were calculated for each satellite image, and the decision-tree used in the classification is shown below.

Results
These are the classified maps of Chengdu.

1990


2002

2014
Conclusion
Remote sensing allows us to track land use and land cover changes over time quite efficiently. Based on the classified maps, the urban area of Chengdu is 11849.7 ha in 1990, and expanded more than tenfold to 123437.8 ha in 2014. Assuming that the rate of urbanization is constant, the mean urban growth is 4649.5 ha per year.